R Test
This guide provides an overview of the Alooba R test. R is one of the most frequently evaluated skills on Alooba, and has become easily the most popular programming language for data-related roles like data scientists, data engineers and data analysts.
Unlike Python, R is very much a data & statistics focused language - web applications are not built with R.
R is one of more than 500+ skills that you can assess on Alooba. You can assess R in various ways on Alooba, including through the dedicated R coding environment and also the Concepts & Knowledge test type.
The best way to evaluate R on Alooba is with the R test in the proper coding environment, as this requires candidates to actually code in R, rather than just understanding some of the core concepts.
Alooba R Test General FAQ
I’m not an Alooba customer yet - how can I get access to the R test?
You can get started with Alooba by signing up directly here for immediate access.
How can I pay for the R test?
When signing up for Alooba and using the R test, you can use any major credit card, and enterprise users can also pay via invoice.
What type of language is R and why is it so popular?
R’s popularity has exploded in recent years, since its original creation by Ross Ihaka and Robert Gentleman in New Zealand, at the University of Auckland back in 1993.
R has a lot going for it as a language for data related work:
- Statistical Analysis: R is designed specifically for statistical analysis and data visualization.
- Open Source: R is free and open-source, making it accessible to anyone.
- Extensive Packages: A vast collection of packages and libraries for various statistical and graphical techniques.
- Community Support: Strong community support with extensive documentation, forums, and tutorials.
- Data Handling: Efficient data handling and storage facilities.
- Integration: Integrates well with other programming languages and tools such as Python, SQL, and Hadoop.
- Reproducibility: Excellent tools for creating reproducible research, including R Markdown for dynamic reporting.
- Graphical Capabilities: Advanced graphical capabilities for creating high-quality plots and charts.
Can I use the R test with other tests?
Yes absolutely, you can use the R test with any other Alooba test too, such as the Data Analyis Test, Diagramming test, SQL test, one-way video interviews and more!
Is this an online R test?
Yes, the Alooba test is delivered fully online/fully remotely, perfect for remote hiring and employees working from home. Testing online gives you the ability to scale your hiring process exponentially. No more bringing candidates into an office one-by-one, and dealing with that headache.
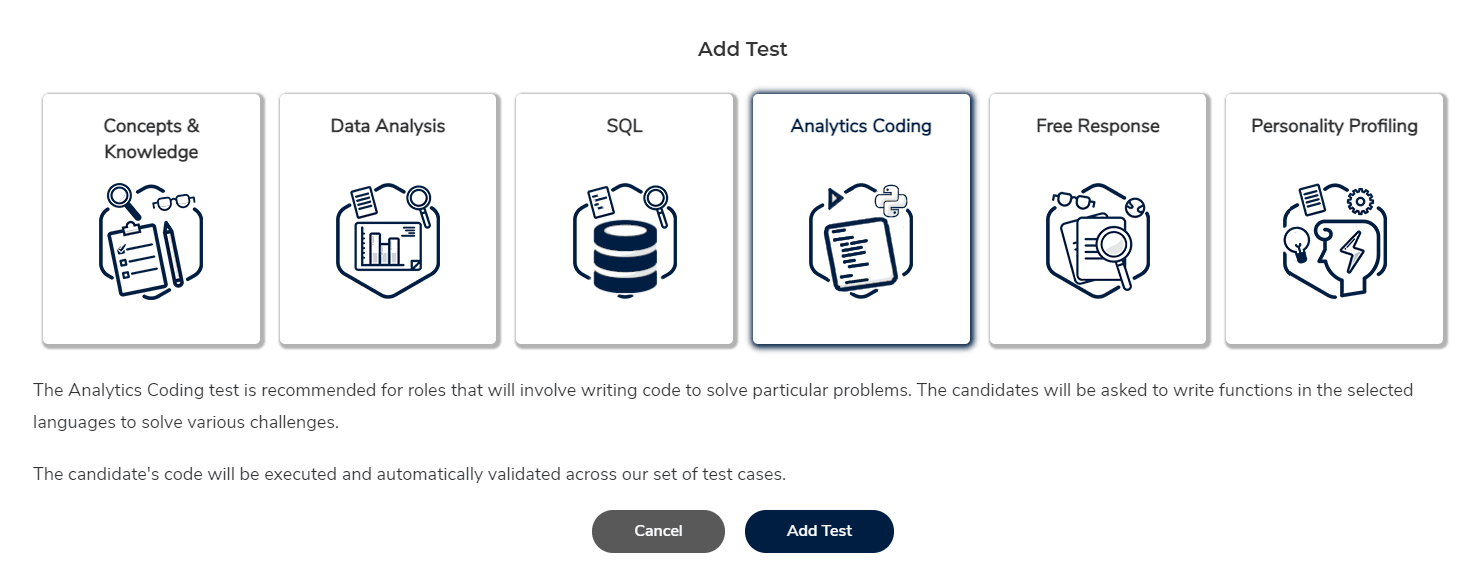
I’m trying to add the R test in Alooba but don’t see it - where is it?
You’ll find it under the ‘Analytics Coding’ test type when creating your test.
What’s the main features of the Alooba R test?
With the Alooba R test, it comes with full customization ability (questions, timing, length, difficulty etc.), advanced cheating prevention, automated grading, a comprehensive bank of different questions, and a simple integrated development environment.
You can see all the features of Alooba products here.
Do I get to pick which questions go into the R test?
Absolutely, you can pick whichever questions you’d like to include in your test, picking from our library of expert-written R questions. You can also add your own custom R questions too if you like.
I need my candidates to know either R or Python, I don’t mind which - is it possible to give candidates the choice of language?
Yes, if you are agnostic about which language the candidate is tested in, then you can leave it up to them to decide. This helps the candidate put their best foot forward and take the test in their strongest language.
We already have our own R take-home test - why shouldn’t we stick with that?
Take home tests are often insightful, but suffer from some really common issues, including that they’re impossible to grade objectively, especially without a way to completely anonymise the candidate’s details, they slow down the hiring process, they are a pain in the neck to administer and often a tonne of work for the candidate. Here’s a more in-depth discussion of using your own manual tests vs a proper skills testing platform.
Why can’t I just ask my candidate R questions in the interview instead?
It’s not best practice to evaluate someone’s R skills in an interview for a few reasons.
Talking through something, using a whiteboard, using pen and paper or having someone breath down your neck as you’re trying to write R are unenjoyable experiences for many candidates, especially introverts or those who suffer from anxiety.
Our recommendation is to evaluate R skills in a professional test environment, which better matches how someone would write R during their job.
If you are going to assess someone’s R skills in an interview anyway, we’d recommend doing at least the following:
- ensuring the candidates are all asked the same questions as each other
- using a pre-defined common scoring rubric for each question
These are some basic components of running a structured interviews process, which is a great way to reduce bias and improve the accuracy of your hiring process. You can create and execute structured interviews using Alooba Interview, and learn more about how to run an ethical hiring process here.
Which kinds of roles does the R test suit?
Any roles that require R as a skill. These are data roles, especially data scientists, and data analysts. R is a bit more niche than Python as a skill.
What topics are covered in the Alooba R test?
The R questions available in the R test cover a range of topics from basic to advanced R, with a particular focus on common challenges and tasks in data science, data engineering and data analysis.
This includes things from basic data collection to simple manipulations (e.g. using tidyverse), through to more advanced data science modeling work. You can see the topic of each question when you set-up your assessment.
How long does the R test take the candidate to complete?
The test time is customisable, so you can make it as long or short as you like. Typically the overall assessment time of Alooba assessments would be around 20-40 minutes when used as a screening tool, and 1-2 hours when used as a more in-depth assessment, later on in the hiring process. Note, the R test is only one of many test types in Alooba, and your assessment might include other tests like the SQL test, data analysis test or free response test.
What is the passing score for the R test?
Tests on Alooba don’t necessarily have a ‘passing’ score, however each test you create will have a benchmark score. When you create your R test, the benchmark score will be calculated and shown to you. The benchmark for your R assessment will be the predicted 90th percentile for the set of questions you included in the test. E.g. if the benchmark score is 60%, we’d expect only 10% of candidates to beat that score.
How is the test structured?
Before starting the test, candidates will have the opportunity to take the test for a practice spin. This helps ensure that they are comfortable with the coding environment and know what to expect. Once they start the actual test, it’s then a timed-test environment. The R coding test includes the R questions that you chose to select when setting up the test.
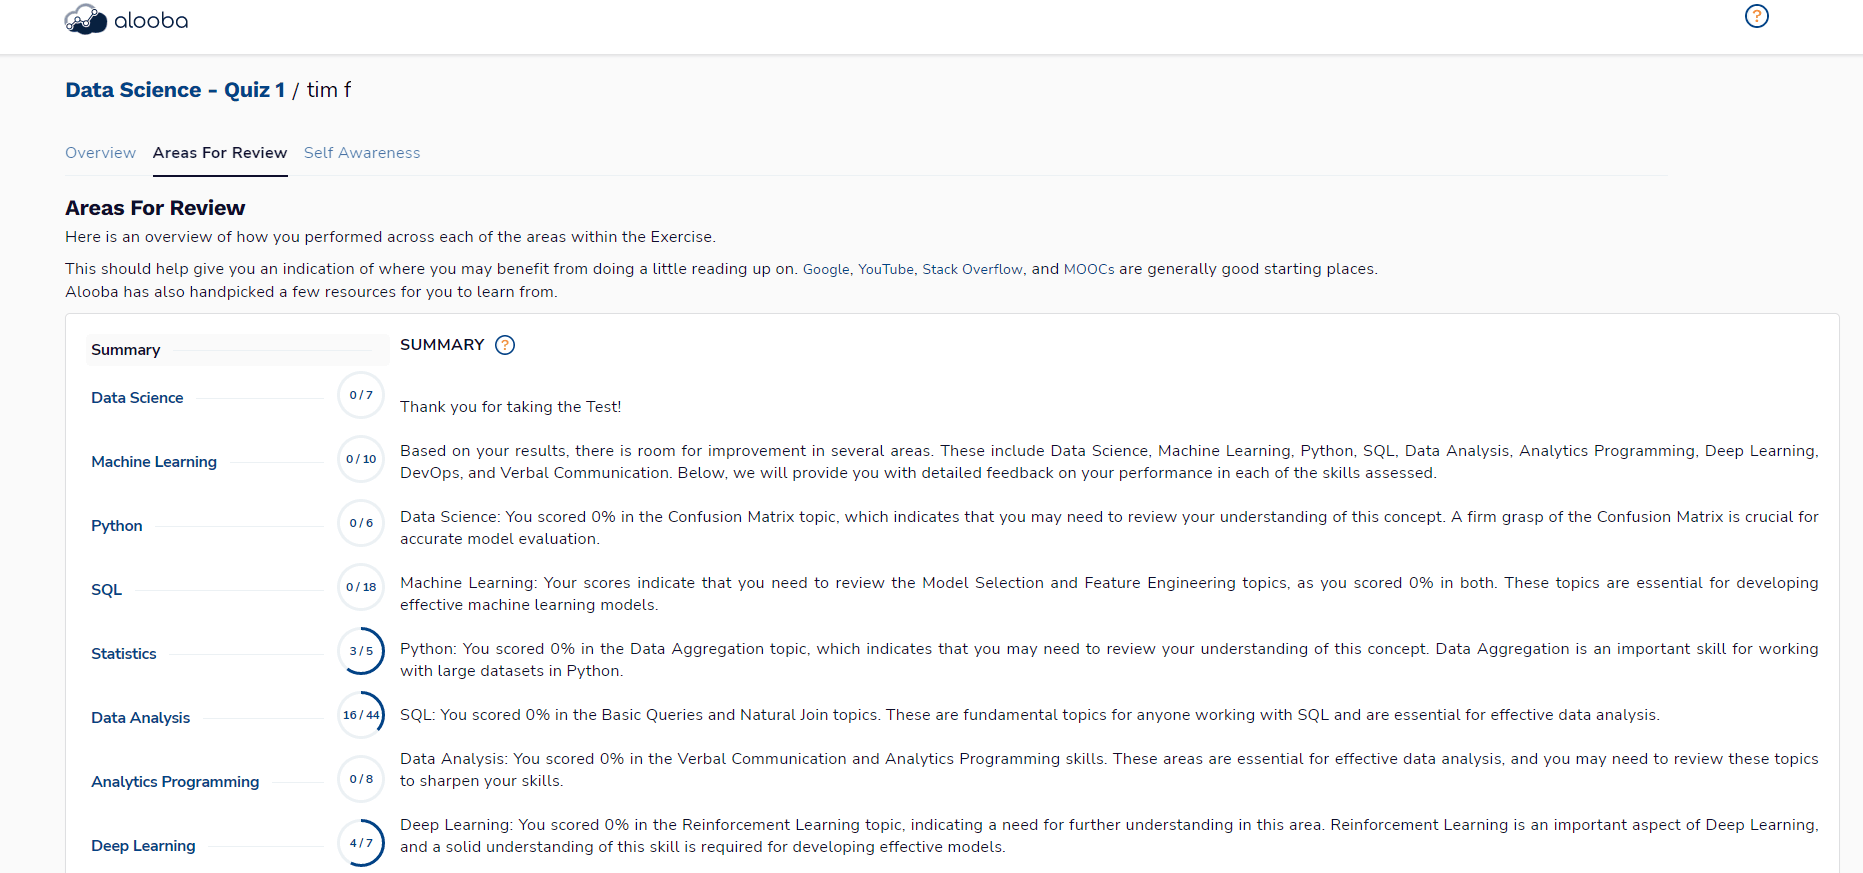
Will candidates receive feedback on their performance?
Yes, if you have configured your assessment to show candidates their results. They will then get immediate feedback on how they’ve performed, including their overall score, performance in specific areas, and suggestions for improvement. Here’s an example of that.
Is there a time limit for each question?
No, there is no specific time limit for each individual question. Candidates will have the time for the test that you have set when configuring the test. They can then spend this time on whichever questions they like.
How can candidates prepare for the R test?
Candidates can prepare for the test by reviewing key R concepts, practicing coding problems, and using resources such as online tutorials, coding platforms, and textbooks. They can also take the free Alooba R test to get comfortable with the coding environment, and prior to completing the actual R test, there’s a practice test available to play around in.
Which R packages are installed on the Alooba R server?
There are a variety (50+) of popular R packages installed in the Alooba R environment, including the incredibly popular tidyverse collection of packages, which includes dplyr, ggplot2 & tidyr, amongst others.
If you’d like to install a new one, no worries - please let your account manager know and we can add it.
Where does the candidate’s R code run?
The candidate enters ‘execute’ during the test on their browser, and then this R code is executed on our server, in a containerised environment. You can see the environment below.
Does the candidate need to install anything to complete the R test?
Absolutely not - they just complete the test in their browser of choice, like all the other Alooba tests.
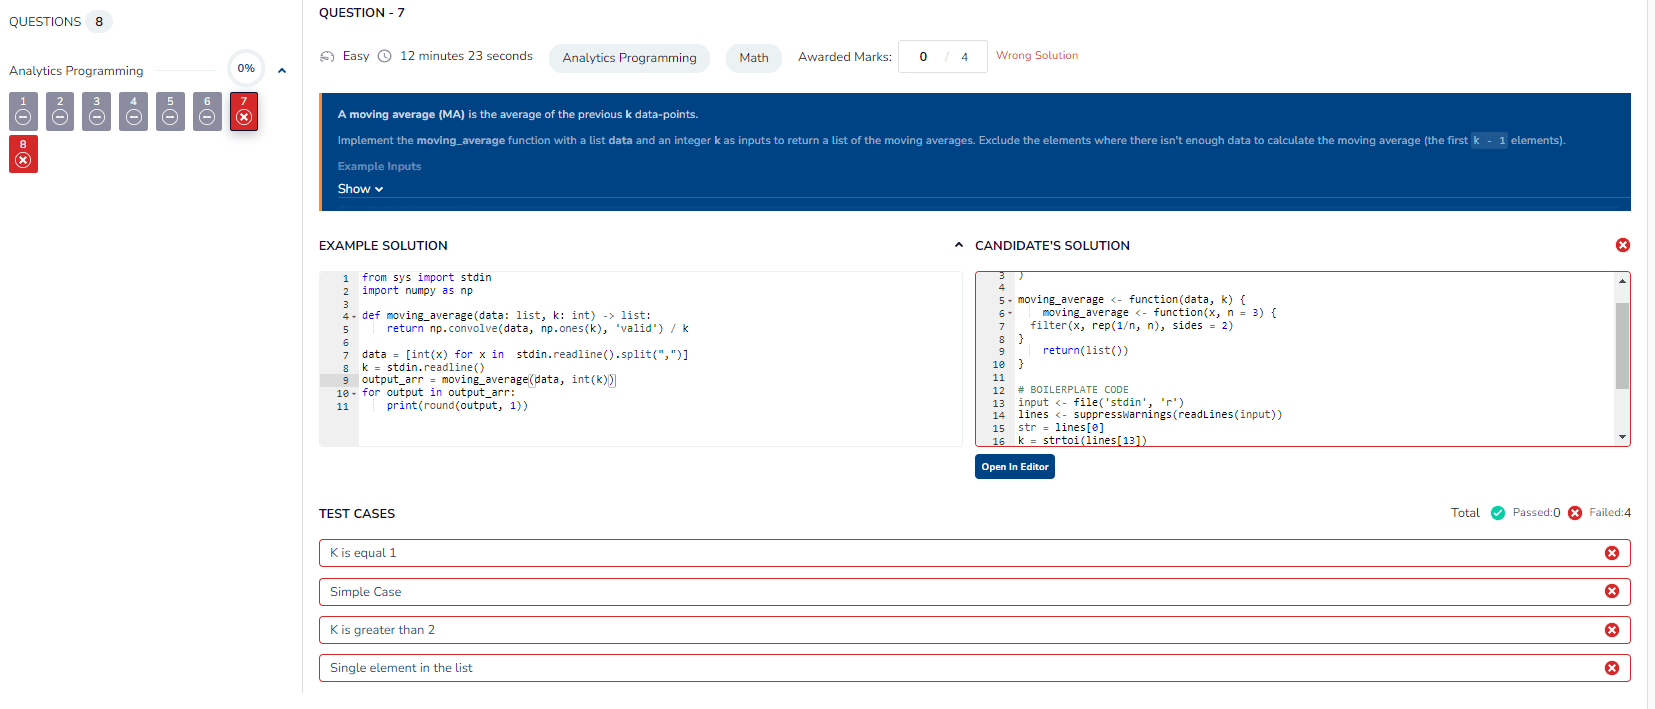
How does the grading work?
The grading for the R test works based on test cases. The candidate’s R code is run against various test cases (input datasets). The candidate then receives points for each test case that passes. A test case passes simply if the output produced using the candidate’s code matches what the expected output was of the correct code/answer key.
Suppose there is a difficult R question worth 8 points, this might have 4 associated test cases with it. The candidate would receive 2 points for each test case that successfully passes.
This grading style is essential to accurately measuring the skills of the candidate, and ensuring that a candidate who makes a minor mistake receives partial credit, rather than just 0 points.
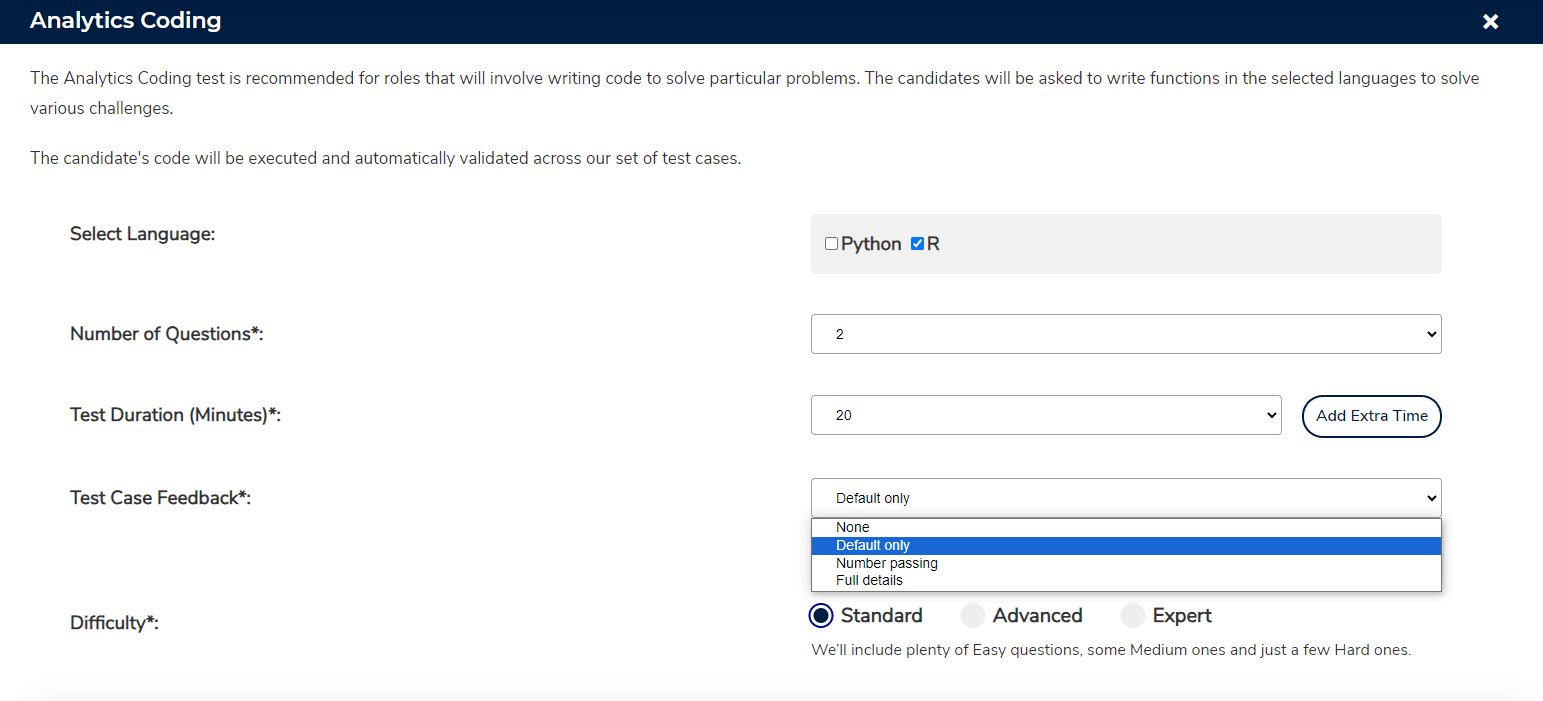
What kind of feedback does the candidate get during the R test?
During the assessment, as the candidate executes their R script, they will get some level of feedback on whether or not their code is passing the test cases. You can choose this when setting up the assessment. You can see there are various options, including no feedback at all, through to full details of which test cases, their names are whether or not they are failing. This transparency gives the candidate feedback and an opportunity to fix any mistakes that they have made.
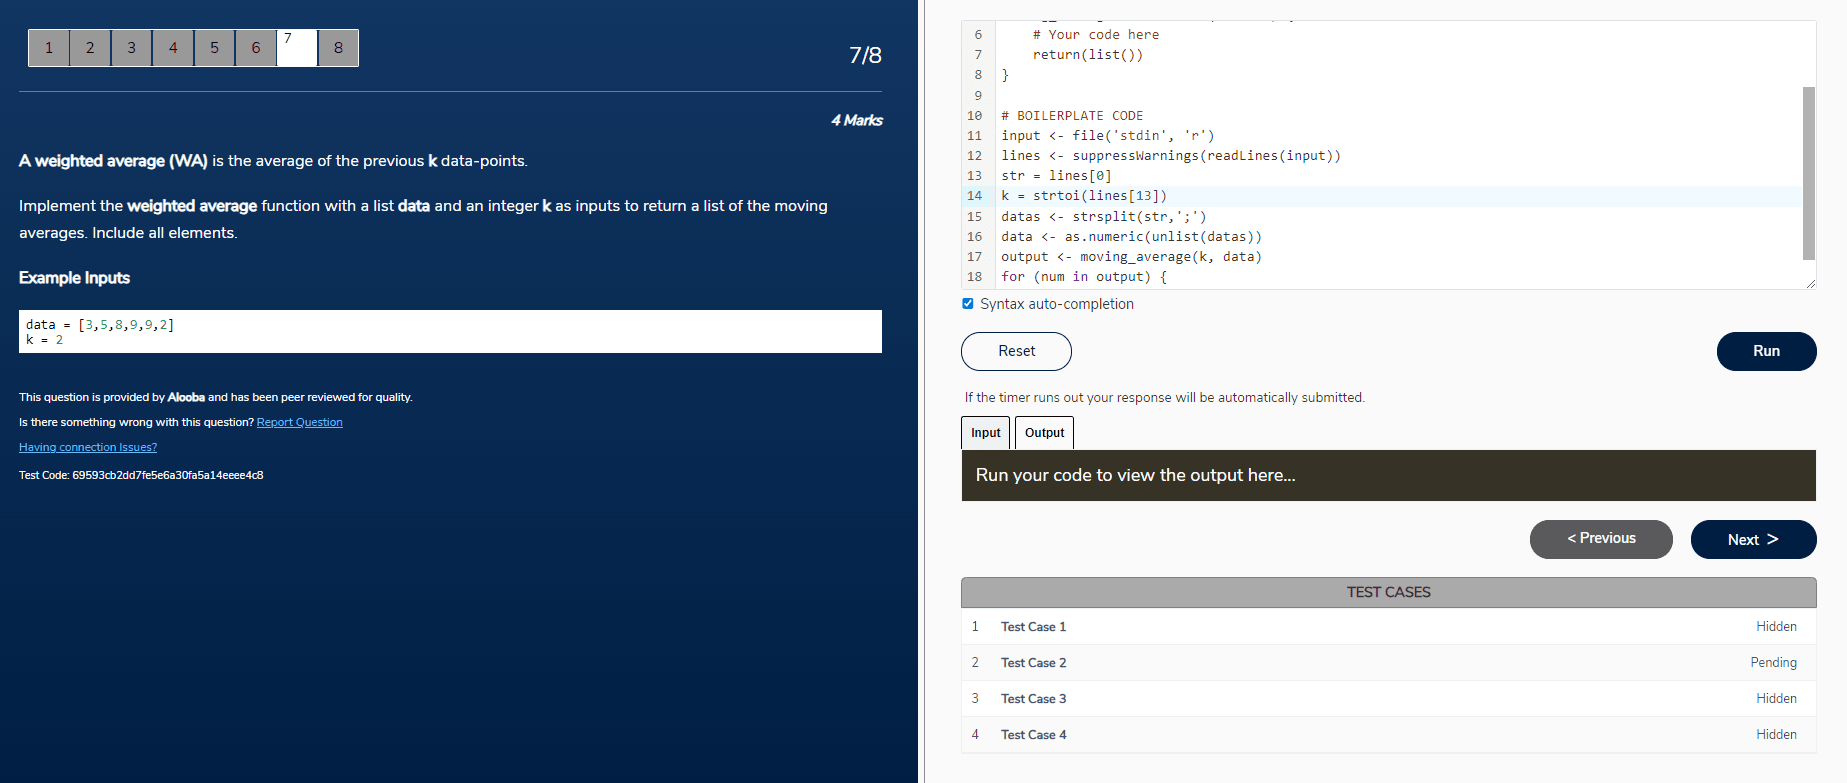
What does the R environment look like for the candidate?
The candidate codes in a clean and simple environment, as shown below.
What do the candidate’s results look like for us? Do we see their code?
Yes absolutely, you get to see the candidate’s code, including seeing exactly how they arrived at their answer, how long they took, which test cases did/did not pass and why etc.
Does the R test come with cheating protection?
Yes the R test comes with Alooba’s advanced cheating protection, which includes AI text detection. Check out our complete guide to prevent candidates cheating.
Is R the only language available in the coding test?
No, you can also evaluate your candidates in R.
You can also test candidates in SQL, under the SQL test.
Looking to evaluate a different language? Reach out to us here as we can easily add C#, C++, Java or any other language.
Can we see an example of the R test?
Sure, there’s a free R test available on Alooba which you can click through and take. Note, this is from a candidate’s perspective. The view as a customer will be different and you’ll get more detailed insights into the strengths and weaknesses of the candidate.
Here’s a free practice R test.
Can the candidate practice the R before taking the real test?
Yes, prior to starting the R test, the candidate has the opportunity to enter the R test environment and practice with some warm-up questions.
What are the benefits of using the Alooba R test?
The Alooba R test is an easy way to evaluate your candidates’ R skills, ensuring they have the right skills for your role. No need to create your own test, administer your own test or grade your own test.
Can I add my own R questions?
Yes, you can add your own R questions through the Alooba question bank.
Is R the same as Python?
No, Python and R are different languages. You can also test a candidate’s Python skills on Alooba with the Python test.
What’s an example of some R code?
This example demonstrates how to perform some basic data science work in R (building a regression model), without installing any packages.
# Load the built-in dataset
data(mtcars)


# Display the first few rows of the dataset
head(mtcars)


# Calculate basic statistics for the dataset
summary(mtcars)


# Create a scatter plot of mpg (miles per gallon) vs. hp (horsepower)
plot(mtcars$hp, mtcars$mpg,
     main="MPG vs Horsepower",
     xlab="Horsepower",
     ylab="Miles Per Gallon",
     pch=19, col="blue")


# Perform a linear regression analysis
model <- lm(mpg ~ hp, data=mtcars)


# Display the summary of the linear regression model
summary(model)


# Add the regression line to the scatter plot
abline(model, col="red")
What’s another R example, but with an installed package?
Here’s another example, but this time installing some super common R packages; dplyr for data manipulation and ggplot2 for visualization. This provides a quicker and perhaps more readable approach compared to base R functions, especially for larger and more complex datasets.
# Install and load the necessary packages
install.packages("ggplot2")
install.packages("dplyr")


library(ggplot2)
library(dplyr)


# Load the built-in dataset
data(mtcars)


# Display the first few rows of the dataset using dplyr
mtcars %>% head()


# Calculate basic statistics for the dataset using dplyr
mtcars_summary <- mtcars %>%
  summarise(across(everything(), list(mean = mean, median = median, min = min, max = max, sd = sd)))


print(mtcars_summary)


# Create a scatter plot of mpg (miles per gallon) vs. hp (horsepower) using ggplot2
ggplot(mtcars, aes(x = hp, y = mpg)) +
  geom_point(color = "blue") +
  labs(title = "MPG vs Horsepower", x = "Horsepower", y = "Miles Per Gallon") +
  geom_smooth(method = "lm", color = "red", se = FALSE)


# Perform a linear regression analysis using base R
model <- lm(mpg ~ hp, data = mtcars)


# Display the summary of the linear regression model
summary(model)